|
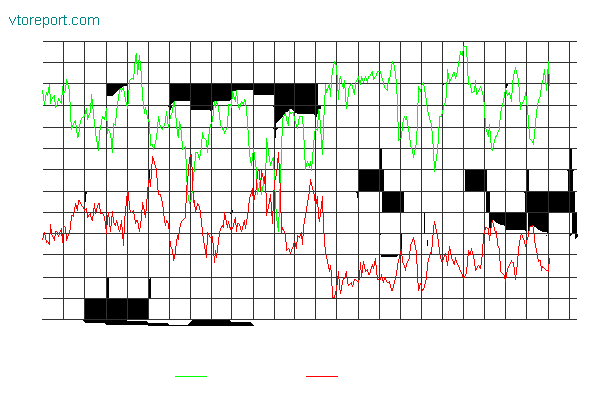
October 7, 2004 |  | | Market Sentiment | | Bullish Advisors: 52.6% Bearish Advisors: 24.2% |
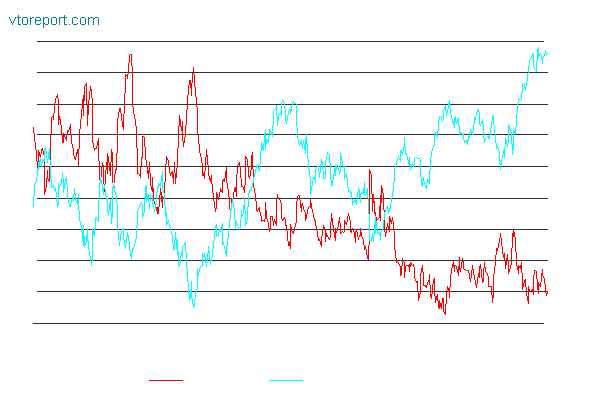
| Market Sentiment vs. S&P 500 |
Bullish Advisors Minus Bearish Advisors: 28.4% |
Put/Call Ratio (Equity Options)
Daily Chart |
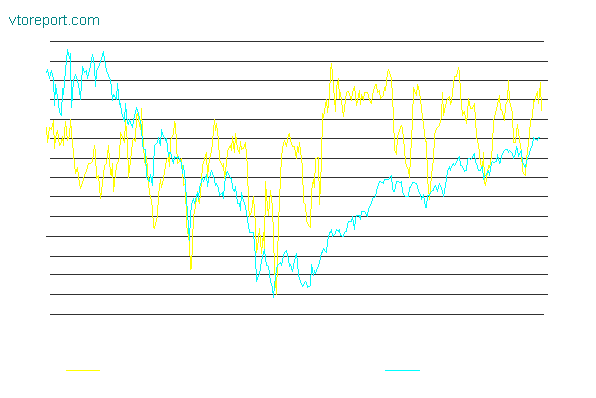
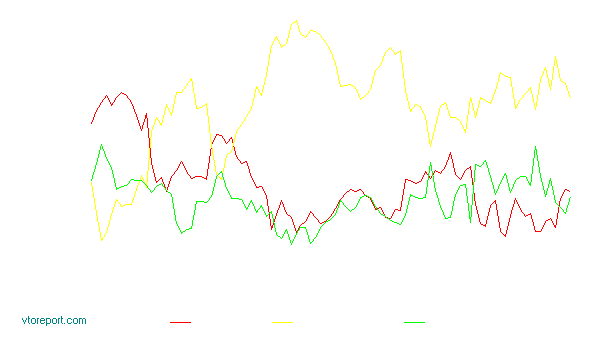
| Market Volatility Index (VIX) vs. S&P 500 | | Today's VIX: 15.05 Previous VIX: 14.50 |
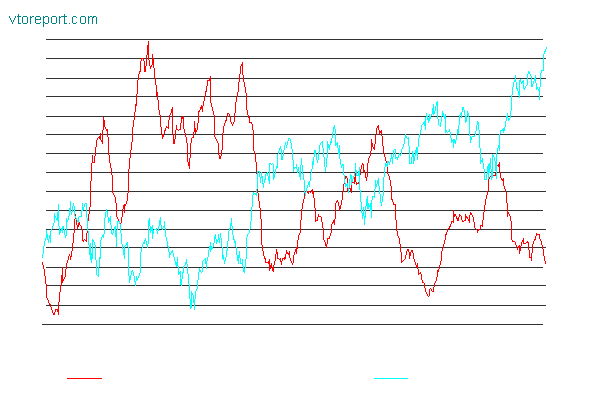
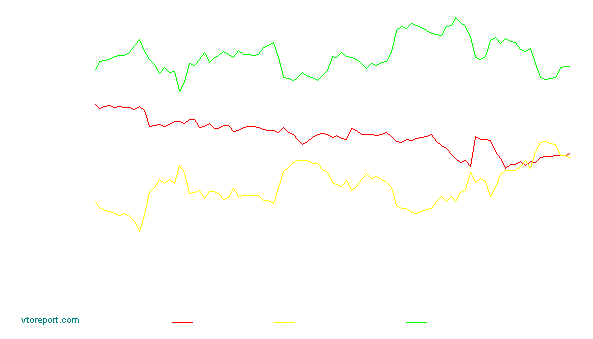
| Nasdaq Volatility Index (VXN) vs. Nasdaq 100 | | Today's VXN: 20.69 Previous VXN: 20.59 |
October 8, 2004
Data: October 5, 2004
Charts: January 2, 2001 to October 5, 2004 |
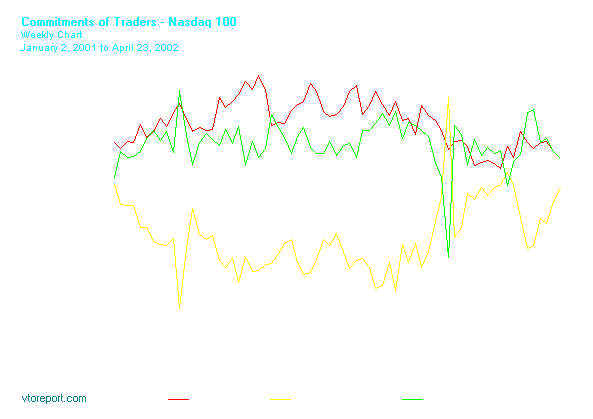
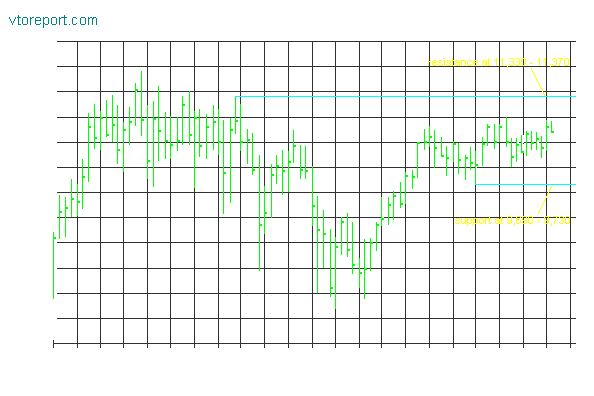
| COT - Dow Jones Industrial Average |
| | Long | Short | Net | | | | | | | | Large | 8,753 | 10,094 | -1,341 | | | | | | | | Commercial | 26,649 | 25,279 | 1,370 | | | | | | | | Small | 5,052 | 5,081 | -29 | | | | | | |
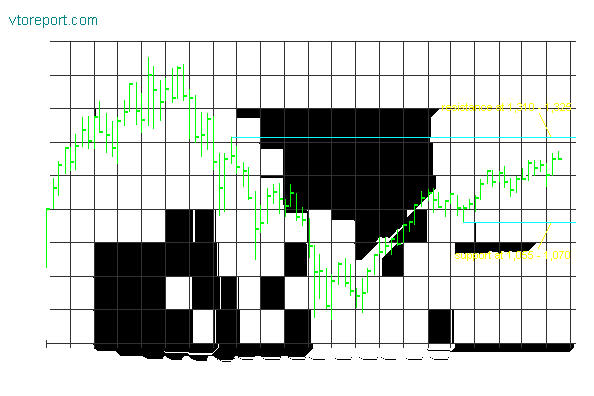
| | Long | Short | Net | | | | | | | | Large | 66,988 | 75,190 | -8,202 | | | | | | | | Commercial | 421,217 | 435,736 | -14,519 | | | | | | | | Small | 137,210 | 114,489 | 22,721 | | | | | | |
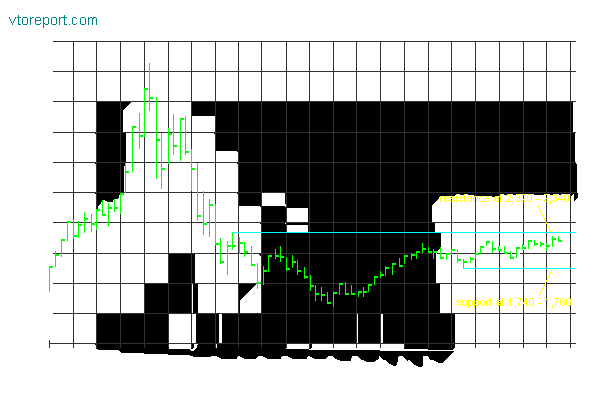
| | Long | Short | Net | | | | | | | | Large | 9,560 | 13,889 | -4,329 | | | | | | | | Commercial | 55,640 | 32,872 | 22,768 | | | | | | | | Small | 12,254 | 30,693 | -18,439 | | | | | | |
Dow Jones Industrial Average
Today's High: 10,148.04 Low: 10,036.32 Close: 10,055.20 Change: -70.20
5-Day RSI: 34.7 - Neutral
5-Week RSI: 41.5 - Neutral | MTD: -0.2% YTD: -3.8% |
S&P 500
Today's High: 1,132.92 Low: 1,120.19 Close: 1,122.14 Change: -8.51
5-Day RSI: 41.9 - Neutral
5-Week RSI: 55.9 - Neutral | MTD: +0.7% YTD: +0.9%
PE Ratio: 20.0
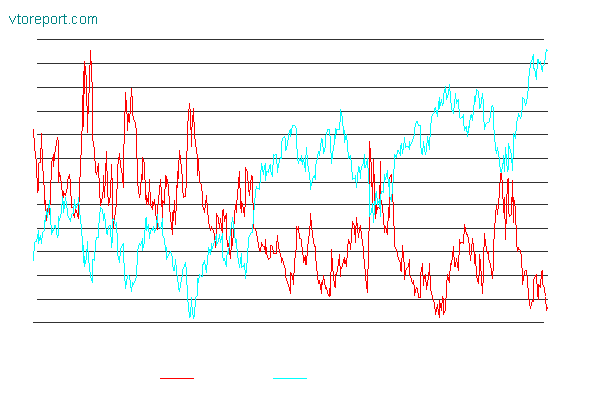
Nikkei 225 vs. S&P 500 |
Nasdaq Composite
Today's High: 1,949.34 Low: 1,917.72 Close: 1,919.97 Change: -28.55
5-Day RSI: 43.1 - Neutral
5-Week RSI: 58.1 - Neutral | MTD: +1.2% YTD: -4.2% |
Greetz f-h  http://www.anmeldung.boerse-total.de http://www.anmeldung.boerse-total.de
|
 1 |
... |
19 |
20 |
21 |
22 |
23 |
24 |


 Thread abonnieren


