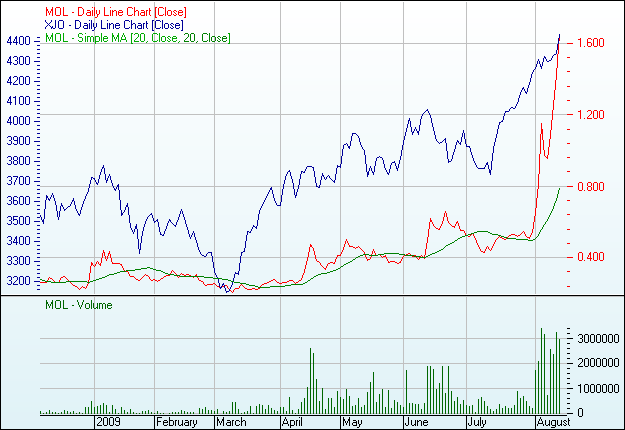
Closing prices are displayed for the last 5 days on which the security traded on ASX within the last 6 months.
Date Last % Change High Low Vol *
12 Aug 2009 1,425 14% 1,470 1,175 3.229.096
11 Aug 2009 1,250 15,21% 1,250 1,085 2.333.479
10 Aug 2009 1,085 13,61% 1,175 0,965 2.540.633
07 Aug 2009 0,955 -1,55% 0,980 0,925 759.398
06 Aug 2009 0,970 -15,65% 1,140 0,890 3.159.569
* Volume of shares shown represents only those shares traded on ASX.
MOLY MINES LIMITED price history chart
ASX excludes all liability arising out of any inaccuracies in this chart, except where liability is made non-excludable by legislation. Chart values may be adjusted for changes in a company's capital structure or to link historical values that represent the company's primary equity security. Explanation of chart terms.
|
Angehängte Grafik:
imagechart.gif (verkleinert auf 81%)

