Einzelwerte zum TTT

Seite 6 von 74
neuester Beitrag: 08.02.06 12:55
eröffnet am: 07.08.04 10:51 von: first-henri Anzahl Beiträge: 1839
neuester Beitrag: 08.02.06 12:55 von: sacrifice Leser gesamt: 243404
davon Heute: 103
bewertet mit 8 Sternen

Seite: Zurück 1 | ... | 2 | 3 | 4 | 5 |
| 7 | 8 | 9 | 10 | ... | 74  Weiter  

25.08.04 18:12
1

9261 Postings, 8246 Tage sbrokerALT

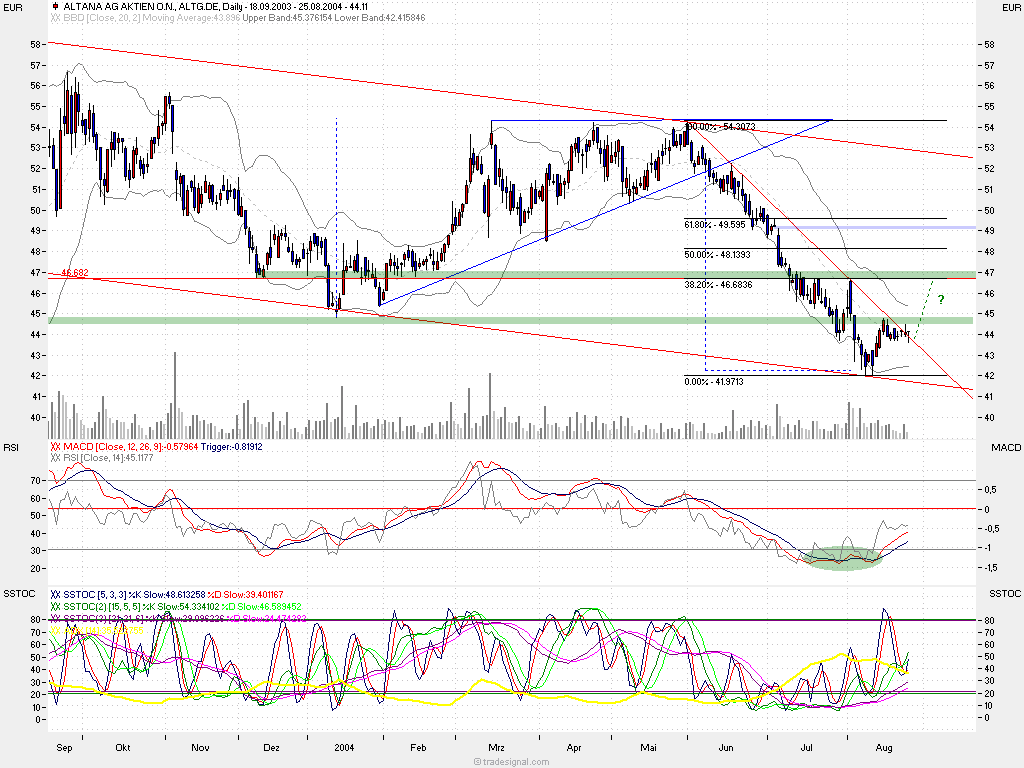
hat heute ein schönes intraday-reversal hingelegt.. closing fast auf TH..über 44. hat sich über Bollinger mitte etabliert.. ist drauf und dran den bislang so vorherrschenden downtrend zu brechen.. indikatorentechnisch sind die weichen eigentlich schon perfekt gelegt - macd, alle 3 stochs (kuz, mittel, lang)..überall kaufsignale bei fallendem adx - das ziel nach oben wäre klar definiert bei knapp 46,70. dort befindet sich ausgedehnt bis 47 ein harter horizontalresist und idealtypischerweise auch das 38er retracement des kompletten downers (54,30-42)..
werden die 43,50 nach unten gebrochen so ist mit einem erneuten heranlaufen an 42 zu rechnen..zumindest aber 42,50 (std.gap).

 
Angehängte Grafik:
alt_25.png (verkleinert auf 49%) vergrößern
alt_25.png

26.08.04 01:46
1

3999 Postings, 7536 Tage efhaupdate

26.08.04 01:58

3999 Postings, 7536 Tage efhabayer

27.08.04 02:19

36803 Postings, 8291 Tage first-henriupdate

27.08.04 02:24
2

36803 Postings, 8291 Tage first-henrineu auf watch...e.on wg. mixalis

27.08.04 09:03

18298 Postings, 8515 Tage börsenfüxleinmorgen zusammen...

würde gerne die Allianz shorten...mit SL bei Kursen über 81...hat da wer ne Meinung/Chart dazu ?

mfg
füx  

27.08.04 11:44

25951 Postings, 8416 Tage Pichel@füxlein:

sehe hier heute gute käufer in alv und beobachte seit tagen alc tausch von muv2
@alle:  Bayershort geht heute durch das SB !!!!


Gruß Pichel  

27.08.04 11:48

18298 Postings, 8515 Tage börsenfüxleindanke für die Info Pichel...

denke ich werde mich irgendwann kommende Woche ärgern, dass ich die Allianz heute nicht geputtet habe...

mfg
füx


27.08.04 11:52

25951 Postings, 8416 Tage Picheldas meinst du aber nur, weil du sowieso bearisch

zum Markt eingestellt bist ,-)


Gruß Pichel  

27.08.04 11:52

25951 Postings, 8416 Tage Picheldas meinst du aber nur, weil du sowieso bearisch

zum Markt eingestellt bist ,-)


Gruß Pichel  

27.08.04 11:55

18298 Postings, 8515 Tage börsenfüxlein@pichel

das ist richtig...

füx  

27.08.04 13:12

162 Postings, 7374 Tage shootingstarsilber


mein bevorzugtes szenario: auflösen des keils ca beim 50 rt..danach gen süden mindestens bis zur 200er ggf untere trendbegrenzung


let`s play

 
Angehängte Grafik:
silber.jpg (verkleinert auf 64%) vergrößern
silber.jpg

27.08.04 13:35

162 Postings, 7374 Tage shootingstartui ausbruch?


strong watch :)


let`s play

 
Angehängte Grafik:
tui.jpg (verkleinert auf 64%) vergrößern
tui.jpg

27.08.04 16:16

25951 Postings, 8416 Tage PichelADS bei 106,50 ausgebrochen!

Bayershort wird heute wahrscheinlich bei 21,35 SK geclosed - CBK hat die heute morgen auf equalw. von underw. hochgenommen...


Gruß Pichel  

28.08.04 14:27
2

36803 Postings, 8291 Tage first-henriservus und schönes WE @all ...teilupdate...

29.08.04 12:15
1

36803 Postings, 8291 Tage first-henriupdates

29.08.04 12:15

36803 Postings, 8291 Tage first-henriupdates mit Formationen

Bull pennant bei IFX und TUI, (Wimpelformationen)"BULL" PENNANT IN AN UPTREND (BULLISH)  How's that for a pattern?  Remember from the preceding page; 'pennants look very much like symmetrical triangles, but are typically smaller in size (volatility) and duration.'  After a near straight up advance, the market takes only three days before resuming the upmove.  During those few days, participation drops off a bit, but comes back as the market explodes out of the pennant.  (Take a look at all those gaps right before and right after the pennant.  Obviously a very strong and convinced market!)  Commodity Charts Examples Stock Charts ExamplesAscending triangle (bullish) bei T-Online Commodity Charts ExamplesStock Charts Examples The ascending triangle is a variation of the symmetrical triangle.  Ascending triangles are generally considered bullish and are most reliable when found in an uptrend.  The top part of the triangle appears flat, while the bottom part of the triangle has an upward slant.  In ascending triangles, the market becomes overbought and prices are turned back.  Buying then re-enters the market and prices soon reach their old highs, where they are once again turned back.  Buying then resurfaces, although at a higher level than before. Prices eventually break through the old highs and are propelled even higher as new buying comes in.  (As in the case of the symmetrical triangle, the breakout is generally accompanied by a marked increase in volume.) (Chart examples of ascending triangle patterns using commodity charts.)  (Stock charts.) Greetz  f-h http://www.anmeldung.boerse-total.de  

29.08.04 12:23
1

36803 Postings, 8291 Tage first-henriupdates mit Formationen

Ascending triangle bei T-Online


Commodity Charts ExamplesStock Charts Examples

The ascending triangle is a variation of the symmetrical triangle.  Ascending triangles are generally considered bullish and are most reliable when found in an uptrend.  The top part of the triangle appears flat, while the bottom part of the triangle has an upward slant.  In ascending triangles, the market becomes overbought and prices are turned back.  Buying then re-enters the market and prices soon reach their old highs, where they are once again turned back.  Buying then resurfaces, although at a higher level than before. Prices eventually break through the old highs and are propelled even higher as new buying comes in.  (As in the case of the symmetrical triangle, the breakout is generally accompanied by a marked increase in volume.) (Chart examples of ascending triangle patterns using commodity charts.)  (Stock charts.)

Busslish Pennant bei IFX und TUI

"BULL" PENNANT IN AN UPTREND (BULLISH)

How's that for a pattern?  Remember from the preceding page; 'pennants look very much like symmetrical triangles, but are typically smaller in size (volatility) and duration.'  After a near straight up advance, the market takes only three days before resuming the upmove.  During those few days, participation drops off a bit, but comes back as the market explodes out of the pennant.  (Take a look at all those gaps right before and right after the pennant.  Obviously a very strong and convinced market!)


Commodity Charts Examples 

Stock Charts Examples

Symmetrical triangles can be characterized as areas of indecision.  A market pauses and future direction is questioned.  Typically, the forces of supply and demand at that moment are considered nearly equal.  Attempts to push higher are quickly met by selling, while dips are seen as bargains. Each new lower top and higher bottom becomes more shallow than the last, taking on the shape of a sideways triangle.  (It's interesting to note that there is a tendency for volume to diminish during this period.)  Eventually, this indecision is met with resolve and usually explodes out of this formation (often on heavy volume.)  Research has shown that symmetrical triangles overwhelmingly resolve themselves in the direction of the trend.  With this in mind, symmetrical triangles in my opinion, are great patterns to use and should be traded as continuation patterns.

Greetz  f-h

http://www.anmeldung.boerse-total.de


30.08.04 11:25

162 Postings, 7374 Tage shootingstarbmw


kurzfristig sollte das gap wohl erstmal nicht überwunden werden..langfristig aber sicher ein lohnendes investment, da sich bmw am unteren ende des langjährigen aufwärtstrends befindet. vor allem geht es bmw gut, super zahlen..jetzt kommt der 1er, solange der ölpreis also schön aufm teppich bleibt ist großes uppotential gegeben mM


let`s play

 
Angehängte Grafik:
bmw.jpg (verkleinert auf 64%) vergrößern
bmw.jpg

31.08.04 09:19

18298 Postings, 8515 Tage börsenfüxlein@pichel

zu Posting 133:

ich ärgere mich !

füx  

31.08.04 09:58

25951 Postings, 8416 Tage Pichelhat aber nix mit ALV selbst zu tun *g*

Gruß Pichel  

31.08.04 10:05

6338 Postings, 8722 Tage hardyman@Pichel

Allianz hat gestern bei 80,45 ein Verkaufssignal geliefert das heute morgen bei 80,05 bestätigt wurde.
Die Parostrategie funzt nämlich auch mit Einzelwerten, sofern sie schön volatil sind.*gggg*


Gruß, hardyman

Idee


31.08.04 10:13

25951 Postings, 8416 Tage PichelOK, nicht mit beschäftigt

Gruß Pichel  

31.08.04 12:15

25951 Postings, 8416 Tage Pichelup für east

Gruß Pichel  

31.08.04 12:29

1300 Postings, 7374 Tage eastthx pichel =)

gl & hf

ich


Seite: Zurück 1 | ... | 2 | 3 | 4 | 5 |
| 7 | 8 | 9 | 10 | ... | 74  Weiter  
   Antwort einfügen - nach oben